RSI is the first indicator most stock traders learn, and the first one most of them misuse. It is simple to read and easy to trade badly. This is how it actually works, and how to read it without getting faked out.
01What RSI measures
The Relative Strength Index is a momentum gauge. It runs from 0 to 100 and answers one question: how hard has price been pushing in one direction lately, relative to itself. A high reading means buyers have been in control. A low reading means sellers have. That is the whole idea. RSI does not know the news, the chart pattern, or where the market goes next. It only measures the strength of the recent move.
The default is a 14 period RSI using Wilder's smoothing, the same maths J. Welles Wilder published in 1978. On a daily chart that means it weighs the last 14 sessions. Change the period and you change how twitchy it is: a shorter period reacts faster and fires more signals, most of them noise; a longer period is calmer but slower. Start at 14 and leave it there until you have a real reason not to.
02Oversold and overbought
Two lines matter: 30 and 70.
Below 30, RSI is oversold: sellers have pushed hard and may be running out of room. Above 70, it is overbought: buyers have pushed hard and may be getting tired. Those are the zones where reversals often begin.
Here is the mistake that costs beginners money: oversold does not mean buy, and overbought does not mean sell. In a strong trend, RSI can sit above 70 for weeks while price keeps climbing, or stay pinned under 30 while a stock bleeds out. Overbought is not a ceiling. It is a sign the move is stretched, not a promise it is over. Treat 30 and 70 as places to pay attention, not buttons to press.
03The signal worth more: divergence
The most useful thing RSI shows you is the moment it stops agreeing with price. That is divergence.
Say a stock prints a higher high, but RSI prints a lower high at the same time. Price went up, yet the momentum behind it faded. That is bearish divergence, and it often shows up before a top. The reverse, price making a lower low while RSI makes a higher low, is bullish divergence, and it often shows up before a bounce.
Divergence is stronger than a bare oversold reading because it tells you something price alone does not: the current move is losing fuel. It is not a guarantee, nothing here is, but it is the RSI signal experienced traders actually wait for.
04Why one timeframe lies
An RSI of 28 on the 1 hour chart looks like a clean oversold bounce. Then you check the daily and it is still overbought, rolling over from a top. The hourly was just noise inside a bigger move down.
This is why timeframe agreement matters more than any single reading. When the 1 hour, daily and weekly all read oversold at once, you have confluence, and the odds tilt your way. When they disagree, the higher timeframe usually wins and the lower one is a trap. Never trade an RSI reading without checking the frame above it.
05Reading the whole market at once
None of this is hard on one stock. The problem is that good setups do not announce themselves, and they rarely happen on the stock you are staring at. The clean oversold bounce is on some name you forgot existed while your eyes were on the megacaps.
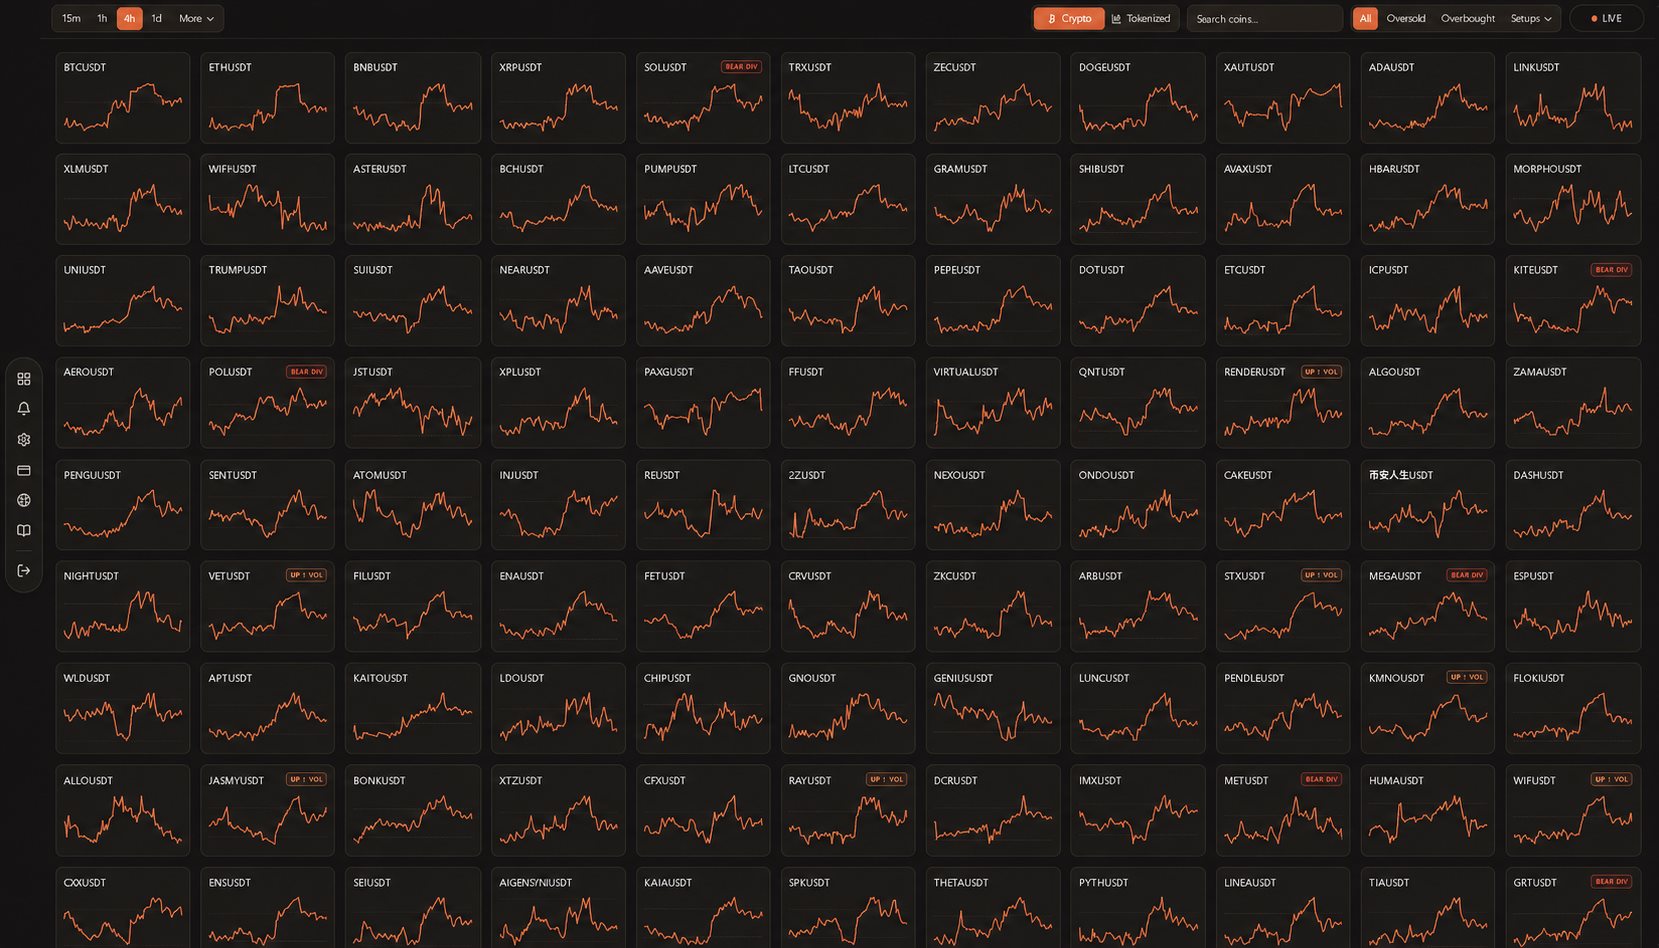
That is the job the RSI screener does: it computes live RSI for the S&P 500 across 7 timeframes and lays the whole market out as a grid, so the oversold and overbought stocks jump out at a glance instead of you flipping through charts one at a time. Tap any stock and the full chart opens with RSI, divergence, and every timeframe in one place.
You can check any stock's live RSI right now, no account needed: Apple, Microsoft, or the full list.
TL;DRThe short version
- RSI measures momentum on a 0 to 100 scale. Leave the period at 14.
- 30 and 70 mark oversold and overbought, but they are warnings, not buy and sell buttons.
- Oversold can stay oversold in a strong trend. Respect the trend.
- Divergence, when RSI disagrees with price, is the signal worth waiting for.
- Always check the timeframe above the one you are trading. Agreement beats any single reading.
Learn to read those five things and you are already ahead of most people using this indicator.
Live RSI on the S&P 500, 7 timeframes
The whole market on one grid, updating live. Free, no card needed.
Open the screener