Stock RSI screener.
The whole market, one glance.
Live RSI for the entire S&P 500. Spot oversold bounces and overbought tops the moment they form — then dig into the fundamentals, earnings and market leadership behind every move.
Free plan, no card needed. Pro is $14.99/month, no auto-renewal.
See every feature before you sign up
The whole dashboard, and everything Pro unlocks, exactly as it looks in the tool.
Live RSI dashboard
FreeThe S&P 500, live RSI, one grid you read at a glance.
How it works
Scan
Open the grid and see the S&P 500 with live RSI and mini-charts. One look shows you where pressure is running out.
Confirm
Tap a stock and flip through timeframes. When 1h, 1d and 1w all agree, you have confluence instead of noise.
Research
Check the fundamentals, earnings and strength versus the market, draw your levels, and export the setup as an image before you take the trade.
Built to be read at a glance
Most stock screeners force a trade-off: powerful but cluttered, or clean but shallow. This one refuses it. A full trading dashboard — real charts, nine indicators, Smart Money Concepts, multi-timeframe confluence, and the fundamentals, earnings and relative-strength research behind every ticker — presented so clearly you read the whole market at a glance. Deep underneath, clean on top.
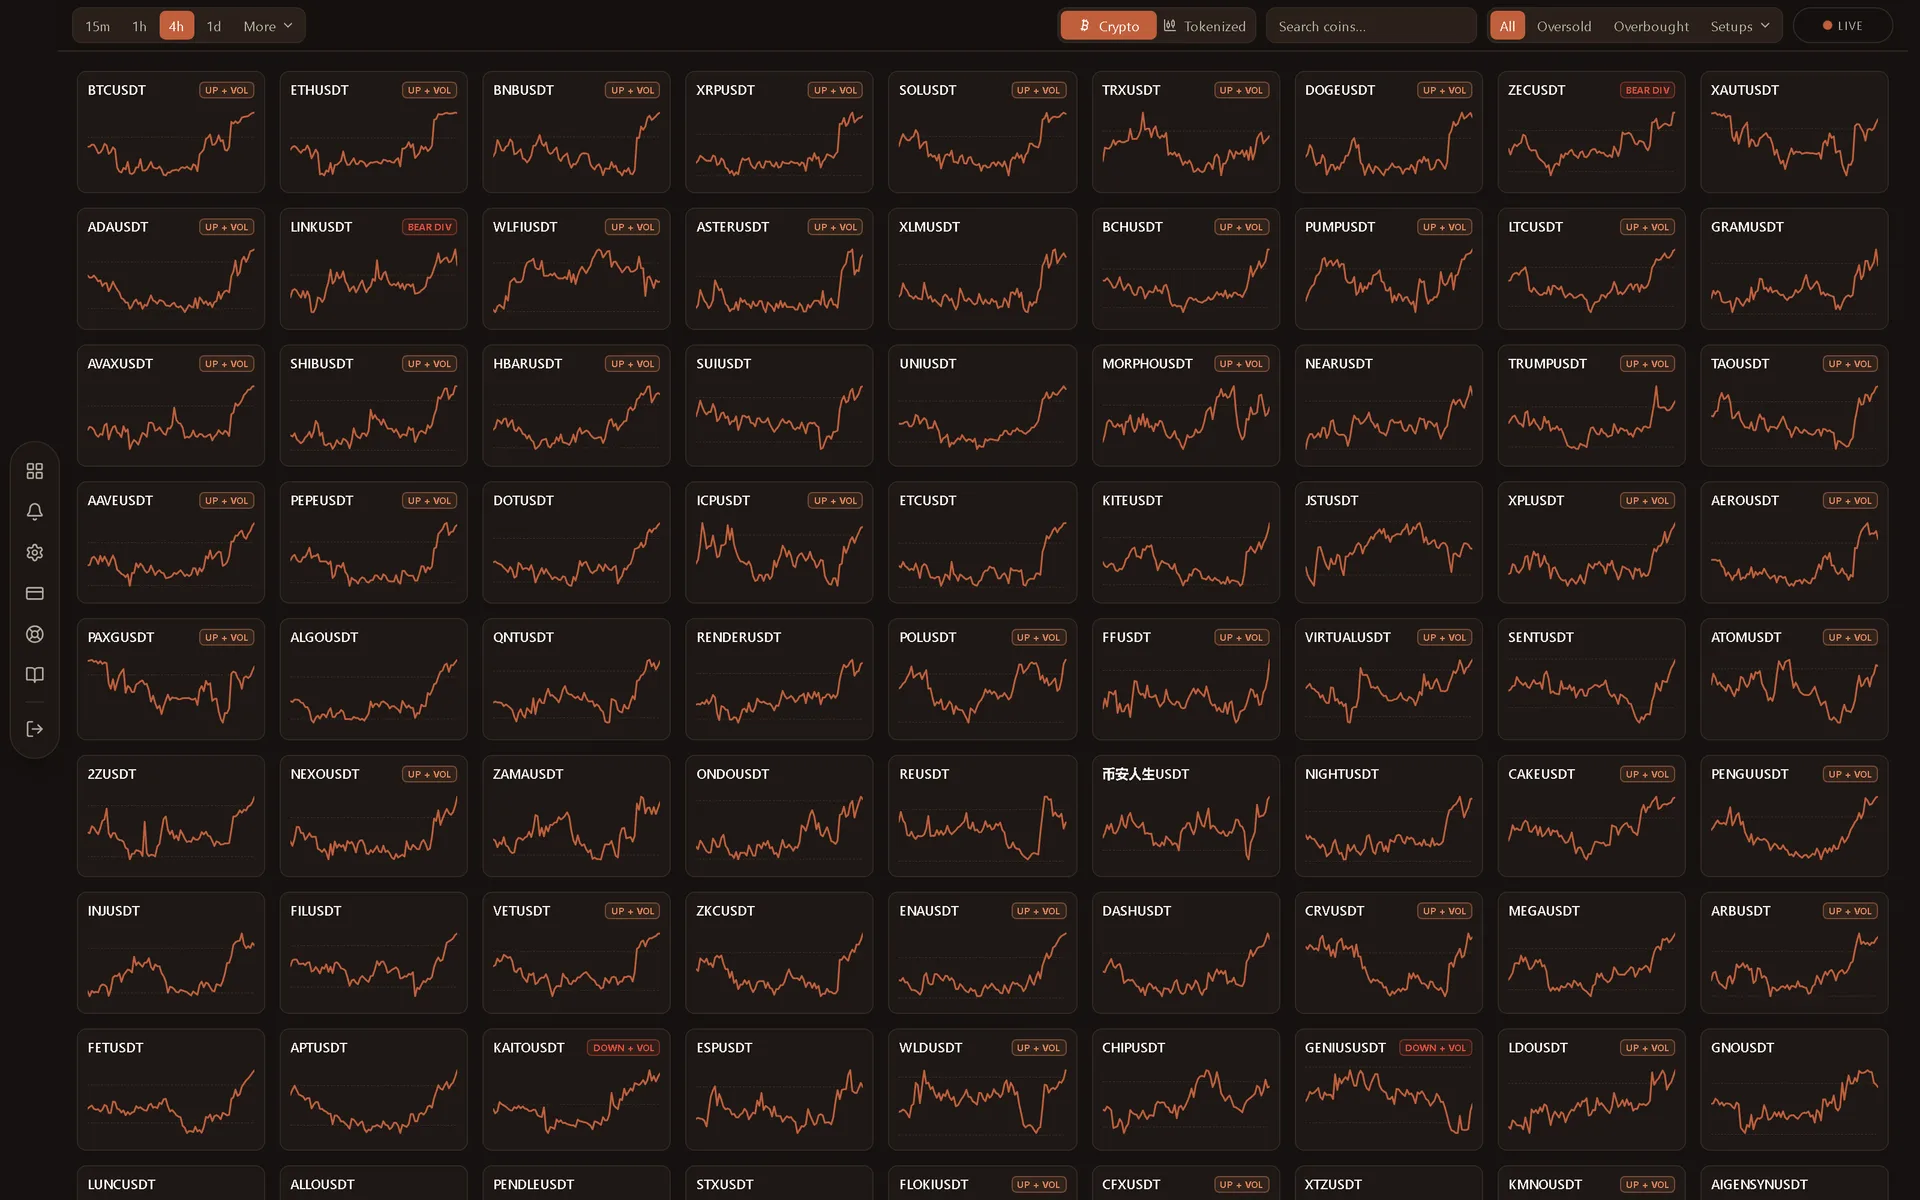
01 Scan layer: live tiles
The whole market is a grid of tiles, each with a live RSI reading and a mini price chart. Color and shape do the work, so oversold and overbought stocks jump out the instant you look.
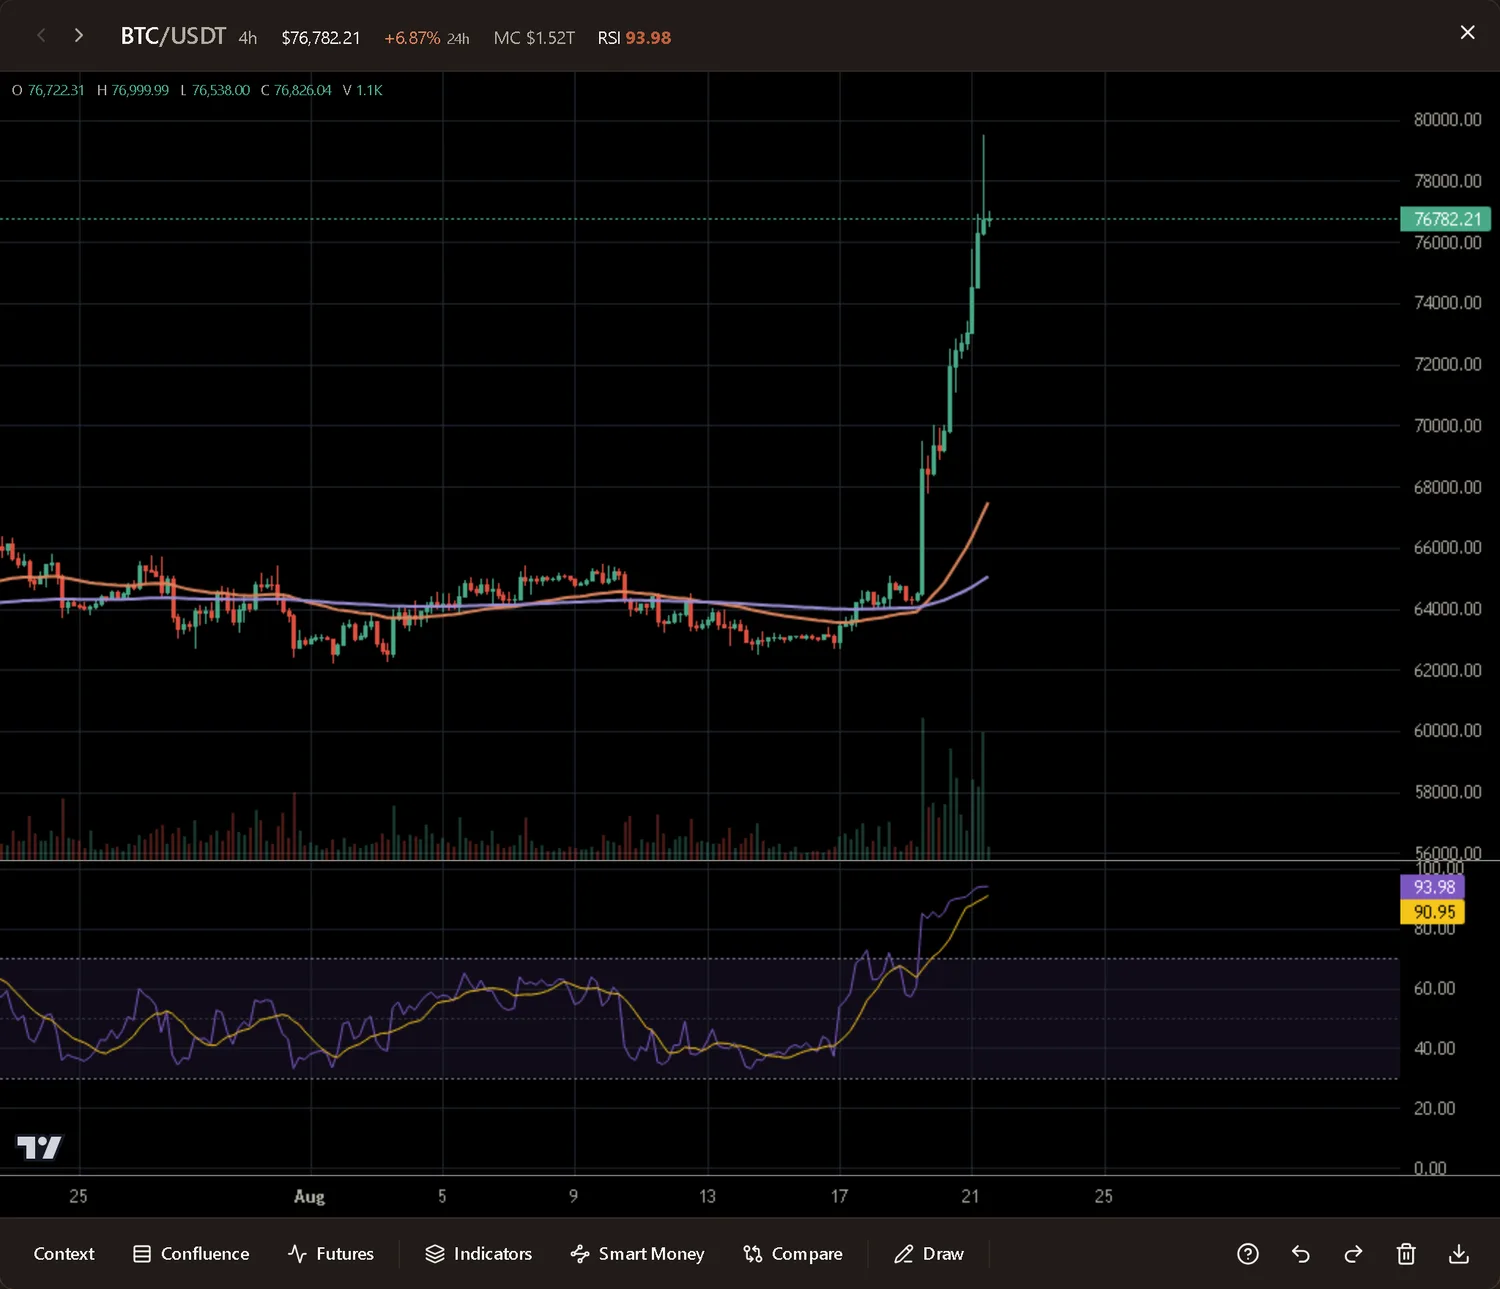
02 Dive layer: one-tap charts
Tap any tile and a full charting workspace opens instantly, ticking live: multi-pane candles, RSI, nine indicators, Smart Money Concepts and the drawing tools, then close straight back to your scan.
Setups, found for you
RSI is where it starts. The screener watches every stock for the three patterns that tend to precede a move, so you can filter the whole grid to them instead of eyeballing a hundred charts to find them.
Bullish divergence
Price prints a lower low while RSI prints a higher low. Selling pressure is fading before price turns.
Bearish divergence
Price prints a higher high while RSI prints a lower high. Buying pressure is fading before price rolls over.
Trend and volume
Price, both EMAs and RSI agree on direction with above-average volume behind the move. Continuation, not a fakeout.
Filter the whole grid down to any one of them, or open a stock for the full context: trend regime, relative volume, and the exact RSI move that triggered the setup.
Pro scans for Smart Money Concepts the same way: break of structure, change of character, liquidity sweeps, unfilled fair value gaps and order blocks, across the entire S&P 500 at once. On TradingView those can only be read one chart at a time.
Ask a question a chart cannot answer
A chart shows you one stock on one timeframe. A scan asks the entire S&P 500 at once, on as many timeframes as the question needs, and hands the answer back in under a second.
Price crosses above EMA 15 on 5m
andRSI 14 is below 30 on 1h
andvolume is 2x its average on 1d
That is one scan. Three timeframes, one answer, and what comes back is a short list of stocks worth opening.
Each condition, its own timeframe
A 5m entry trigger and a 1h trend filter, asked as one question instead of two separate checks.
You see it as it happens
A cross on the 1h shows up the moment price crosses it, not up to an hour later when the candle closes.
Six to start from, then yours
EMA cross, golden cross, MACD cross, oversold, overbought, volume breakout. Change any of their numbers, or open Custom and stack up to ten conditions of your own.
Live RSI on the S&P 500
Market-cap ranked large-cap US stocks, computed on our servers so you never hit rate limits. Filter to oversold, overbought or a setup in one tap.
7 live timeframes
From 5-minute charts to monthly swings, refreshing through the trading day. Switching is instant and the grid fills as it loads.
Charts & drawing tools
Multi-pane charts that open instantly and tick live. Trendlines, Fibonacci with the golden pocket, price ranges and supply/demand zones, all snapping to candles, plus a live OHLC readout and PNG export.
Nine tunable indicators
Two moving averages, Bollinger Bands, Supertrend, rolling VWAP, the Ichimoku Cloud, automatic support & resistance, MACD and Stochastic RSI. Each is editable and recomputed in the browser the instant you change it.
Compare relative strength
Overlay any stock on the price pane to read relative strength against a peer or a sector leader, and see at a glance which one is leading and which is lagging.
Three themes, every device
Dark, Terracotta and Onyx themes, fully responsive with nothing to install. The same tool on phone, tablet and desktop, fast even on mobile data.
Smart Money Concepts
Thirteen SMC overlays drawn straight on the chart, computed live from price. Toggle only the ones you trade and tune swing sensitivity to your timeframe.
Structure
Swing highs and lows, break of structure (BOS), change of character (CHoCH) and displacement.
Zones
Order blocks, fair value gaps, breaker blocks and premium/discount with equilibrium.
Liquidity
Liquidity sweeps, equal highs and lows, liquidity levels, inducement and previous-day high/low.
Simple, honest pricing
A free plan that stays free: the entire S&P 500 with live RSI and charts. Pro unlocks Outlook, the RSI heatmap, Layout for one stock across many timeframes at once, custom scans, Smart Money Concepts, every analysis tool, confluence and compare, with no auto-renewal.
Common questions
Is it really free?
Yes. The free plan tracks the entire S&P 500 with live RSI, filters and charts, with no card and no time limit. Pro adds the deeper analysis: Outlook, which reads one stock's RSI and Stochastic RSI on every timeframe at once, the RSI heatmap, which lays every stock's RSI across five timeframes side by side, Layout, which puts one stock on several timeframes at once as live charts, scans you write yourself and run across every stock, Smart Money Concepts, the full indicator suite, multi-timeframe confluence, compare, plus per-stock fundamentals, earnings and market-leader rankings.
Do I need a brokerage account?
No. The screener reads public market data, so nothing connects to your broker and no API keys are ever asked for.
Where does the data come from?
Public market data for US-listed stocks, computed on our servers with Wilder's RSI and refreshed as each candle closes through the trading day.
Does it work on my phone?
Yes. The same grid and charts run on phone, tablet and desktop, and you can add it to your home screen like an app.
Which stock RSI screener has the best visualization?
This one is built around it. The whole market is a clean, colour-coded grid of live tiles instead of a dense table, and any stock opens a full charting workspace in one tap. It stays clear without being basic: powerful when you need it, uncluttered when you do not, and the same on phone, tablet and desktop.
Is it just an RSI screener, or a full charting tool?
Both. It starts as a live RSI grid for the whole market, then any stock opens a full charting workspace: multi-pane candlesticks, nine tunable indicators (moving averages, Bollinger Bands, Supertrend, VWAP, Ichimoku Cloud, automatic support and resistance, MACD and Stochastic RSI), thirteen Smart Money Concepts overlays, multi-timeframe confluence and drawing tools. Pro also opens Outlook, which stacks one stock's RSI and Stochastic RSI across every timeframe from 1h to 1mo, and lets you write your own scan, mixing timeframes in a single question, and run it across every stock on live price. And it goes beyond charts: per-stock fundamentals and earnings from SEC filings, market-leader rankings by strength versus the S&P 500, and a market-context read of relative volume, range and the earnings clock.
The market is moving right now.
Sign up in under a minute. The grid is live before your coffee cools.
Start freeNo card. No time limit.